Signals Before Storms
An HMM regime overlay, graded honestly: the model worked, the strategy did not.
A regime-switching tactical asset allocation engine that detects Bull, Bear and Crisis states with a 3-state Gaussian HMM, then reallocates across equity, cash and gold via per-regime convex optimization. Validated with a leak-proof expanding walk-forward backtest on India (primary) and the US (robustness), and published as a rigorous negative result with a diagnosis rather than as a winning strategy.
- Domain
- Quant Research
- Artefact
- Dashboard
- Basis
- grades 8 books over 1,814 out-of-sample days
- Stack
- Python · hmmlearn · cvxpy · Walk-forward backtest · yfinance
What it produced
- 1,814
- out-of-sample days graded
- -6.2%
- max drawdown vs -23.7% for 60/40
- 11 of 11
- markets ordered by volatility, 2 by return
Crisis-labelled days
+18.4%
Bull-labelled days
+10.2%
Annualized return by regime label. Volatility orders the states correctly, return orders them backwards, so de-risking on the crisis label sells the rebound about as reliably as it dodges the crash. This is the finding, and it is the reason the project is published as a negative result.
Source: Highlight 1 above: crisis-labelled days annualize +18.4% against bull at +10.2%
Volatility orders the regime states11 of 11
Return orders the regime states2 of 11
Extending detection to 11 markets sharpens the negative result rather than rescuing it. The regime label is a volatility detector; it is not a return predictor.
Source: Highlight 5 above: volatility ranks the states in 11 of 11 markets, return in 2 of 11
The problem
Regime-switching overlays are a standard pitch: detect the crisis state, de-risk, outperform. Most public backtests report a Sharpe ratio and stop, without leak-proofing the pipeline, costing the benchmark on the same terms, or asking whether the regime label predicts direction at all.
The approach
Causal features (momentum, realized volatility, VIX) feed an HMM refit inside every walk-forward fold, decoded with a forward filter rather than whole-sequence Viterbi, with train-only scaling and a one-day execution lag, each defence pinned by a unit test. Per-regime convex programs set the weights, every book (strategy and benchmark alike) runs through the same 7.5 bps cost engine, and the scorecard is deflated at an openly stated 7-trial count with paired bootstrap confidence intervals.
What it found
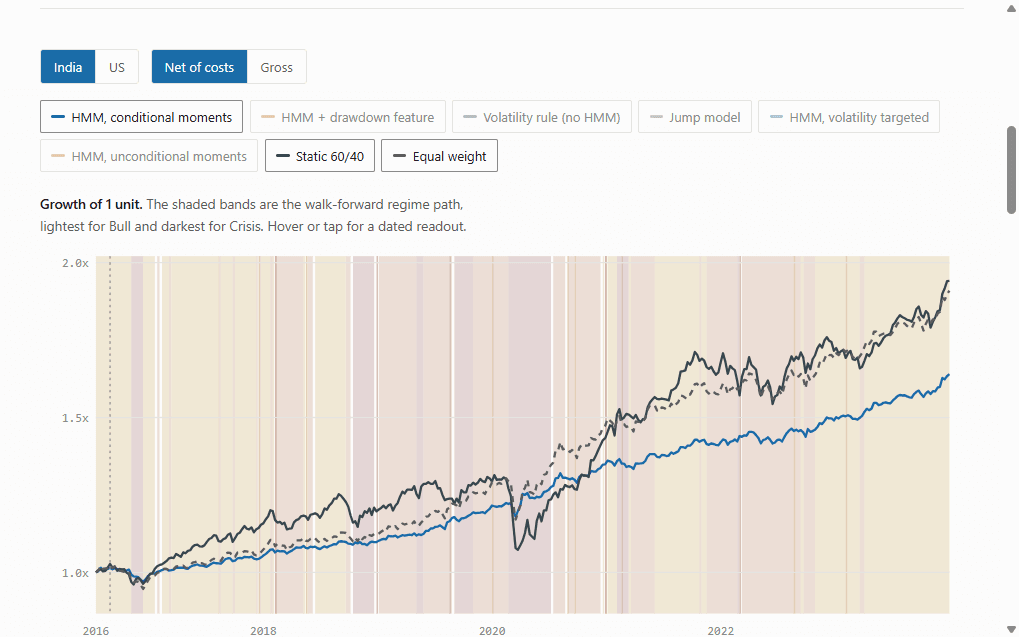
The finding: volatility orders perfectly with the regime label and return orders backwards, on both universes. Crisis-labelled days annualize +18.4% against Bull at +10.2%, so de-risking on the crisis label sells the rebound as reliably as it dodges the crash
Paired difference testing rather than overlapping intervals: every book's Sharpe gap against 60/40 and equal weight spans zero, so the noise reading is earned rather than assumed
What the overlay does buy is drawdown, -6.2% against -23.7% for 60/40 on India, and that protection does not reproduce on the US, where a two-line volatility-threshold ablation beats the HMM outright (0.958 vs 0.542 Sharpe)
Effective sample size counted in episodes, not days: the 261-day crisis label is 14 episodes, and this check retracted the project's own apparent discovery, documented rather than quietly dropped
Extended to 11 markets in a detection-only live monitor: volatility ranks the states in 11 of 11, return in 2 of 11, which sharpens the negative result instead of confirming it
Vendor data guarded, not trusted: two bad Yahoo prints in GOLDBEES.NS inflate gold's return standard deviation from 0.011 to 0.139 and poison every Indian covariance if left alone