10Equities
Ground Truth
India announces data centres in gigawatts and delivers them in megawatts. How much of the announced capacity is actually switched on?
A forensic read of what India's listed data centre operators announce against what they have energised. Eight operators, four annual reports and prospectuses read page by page and pinned by hash, 119 earnings calls coded, five SEC filers harvested and one Ministry of Power dataset. The sector is being priced on announcements, and announced capacity and live capacity are both quoted in megawatts, which is what lets the two be conflated.
- Domain
- Equities
- Artefact
- Dashboard
- Basis
- reads four filings page by page and pins 104 published claims as build invariants
- Stack
- TypeScript · Python · SEC EDGAR / XBRL · Earnings call transcripts · Ministry of Power data · Build-time invariants
What it produced
- 10.6 GW / 619 MW
- announced against live capacity, 8 operators
- 5.8%
- of announced capacity carrying load
- 2 of 8
- operators traced to a primary filing
Sify Infinit Spaces
60%
E2E Networks
40%
STT GDC India
37%
Nxtra by Airtel
13%
Techno Electric
10%
Anant Raj Cloud
9%
Reliance Jamnagar
0%
AdaniConneX
0%
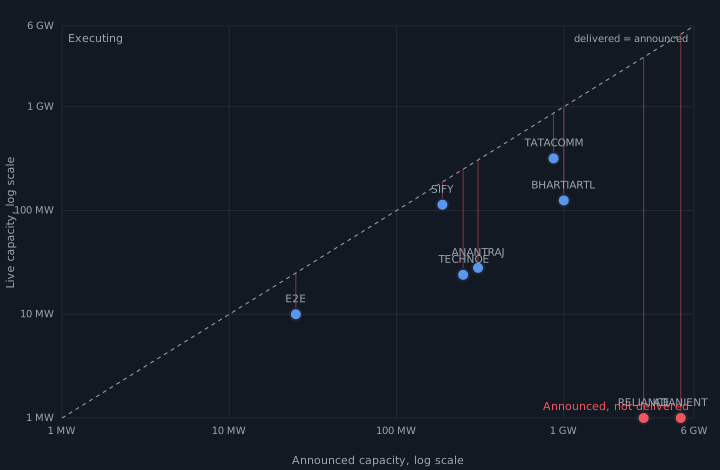
Share of announced capacity that is live, by operator. Sify is the only estate here traced to a filed document, and it is also the best performer, which is the uncomfortable part: the operators with the largest announcements are the ones whose numbers cannot be checked.
Source: Highlight 2 above, read from filings, annual reports and a research note, each row tagged with its sourcing
The problem
A capacity table implies that a megawatt is a megawatt. It is not. One prospectus defines built capacity as the maximum IT load a facility is engineered to support, calculated from present design specifications, so nothing has to be constructed for the number to be true. Eleven days later the same estate was described on an earnings call as 188 megawatts of design capacity of which about 130 is built, using the ordinary meanings. One estate, one date, three different numbers, all of them the company's own.
The approach
Every company figure is read from a filed document and cited by printed page, and every sector figure carries a verification tag saying whether it is primary, secondary or unverified. Findings are compiled into build invariants rather than prose: if a published claim stops being true the build fails instead of the page quietly going stale. Where a measure came out against the thesis it is published anyway, and where a published claim was wrong the correction is kept on the page rather than edited away.
What it found
The headline: 10.6 GW announced across 8 operators against 619 MW live, which is 5.8% of what has been announced and a factor of 17 between the two numbers. Every one of the eight sits below parity
Delivered share by operator: Sify 60%, E2E Networks 40%, STT GDC India 37%, Nxtra by Airtel 13%, Techno Electric 10%, Anant Raj 9%, Reliance Jamnagar 0%, AdaniConneX 0%. The last two hold 8 GW of announcements between them and have nothing live
Only 2 of 8 operators are traced to a primary filing. The rest are research note figures carried at secondary or unverified and tagged that way on every row, because a figure nobody checked and a figure the company does not publish are different problems
Anant Raj announces 307 MW and calls 28 MW operational, while its own annual report reports 8 MW handed over to customers, which is 2.6% of what was announced. The 28 breaks down as 6 MW operationalised, 15 ready to operationalise and 7 at advance stage: three states of readiness inside one headline
E2E Networks publishes no capacity at all. Its annual report contains no megawatt or kilowatt figure anywhere in 148 pages, because it is a tenant in someone else's hall
Reading all 433 printed pages of Techno Electric's annual report: 896.35 mn of overdue receivables the auditor drew attention to and left unprovided, 251.03 mn of disputed tax, and 194.59 mn moved from trade payables into borrowings with no cash moving. The business it calls its most consequential strategic decision in a generation has no segment disclosure at all, so no revenue, margin or asset base can be separated from the engineering business funding it
Demand is three counterparties. On the one operator whose client table is filed, three hyperscalers are 67% of revenue and one of them alone is 44.68%
A measure that came out the wrong way is published anyway. Asked how often each operator refuses a unit economics question, the Indian operator refuses least, but it is asked 0.43 such questions a call against Digital Realty's 0.81, so the asking is the bar and the refusing is only the fill