ENSO Macro Risk Desk
When the ENSO cycle shifts, which commodity exposures are causally real, and which are spurious?
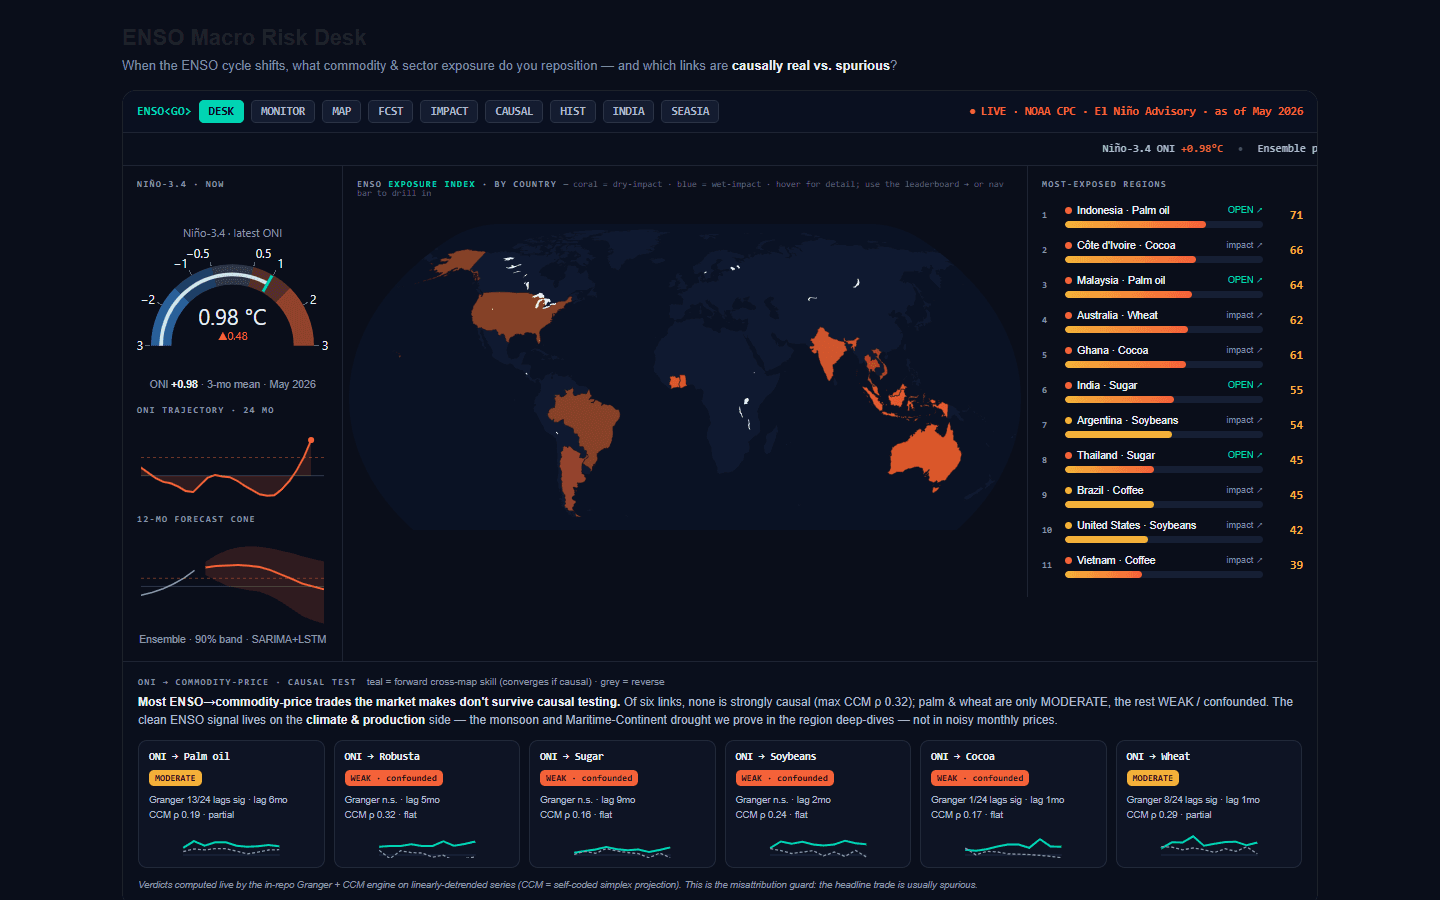
A live commodity risk desk built around the El Niño–Southern Oscillation: Niño-3.4 ONI tracking with a SARIMA+LSTM forecast cone, country-level exposure indices, and, the core idea, Granger + CCM causal testing of every headline ENSO→commodity trade.
- Domain
- Climate Macro
- Artefact
- Dashboard
- Basis
- causal-tests 6 headline ENSO trades
- Stack
- Python · Granger / CCM · SARIMA + LSTM · NOAA CPC data · Docker
What it produced
- 6
- headline links causal-tested
- 11
- exposed regions ranked
- 90%
- forecast cone band (SARIMA+LSTM)
0.32
0strongest of six tested links1
Convergent cross-mapping strength for the strongest of the six headline ENSO to commodity-price links. Cross-map skill runs from 0 to 1 by construction, and none of the six clears the bar for a strong causal reading, so the desk fails its own headline trades rather than repeating them.
Source: Highlight 1 above: of six headline links, none test strongly causal, max CCM rho 0.32
The problem
Every El Niño advisory triggers the same headline trades: long palm oil, long cocoa, short wheat. Most of those links never survive causal testing; desks reposition on correlations that are confounded or spurious.
The approach
NOAA CPC ONI data feeds a live desk: a 24-month ONI trajectory with a 12-month ensemble forecast cone (SARIMA+LSTM, 90% band), an ENSO exposure index across producing countries, and an in-repo Granger + CCM engine that stress-tests each ONI→commodity-price link on linearly-detrended series. A misattribution guard flags which trades are MODERATE, WEAK, or confounded.
What it found
Causal verdict: of six headline ENSO→price links, none test strongly causal (max CCM ρ 0.32)
Live Niño-3.4 ONI gauge with NOAA CPC advisory status and 12-month forecast cone
Exposure leaderboard: Indonesia palm oil, Côte d'Ivoire cocoa, Australia wheat and more
Region deep-dives where the clean ENSO signal actually lives: climate & production data