India FS Pulse
Who captures the value in India's UPI, when the busiest half of the network is priced at zero?
What it produced
- 63.9% / 23.0%
- merchant share of UPI transactions against value
- Rs 3,144 Cr
- a quarter that 30bps would have earned on that leg
- 114 bps
- private against public bank margin gap
Merchant, share of transactions
63.9%
Merchant, share of value
23.0%
Person to person, transactions
30.8%
Person to person, value
71.2%
The monetisation gap, 2026 Q2. The merchant leg is the only one a merchant discount rate could be charged on, and it carries most of the transactions and little of the value. Person to person is the mirror image, and it is the leg nobody could charge for anyway.
Source: Highlight 1 above: merchant 63.9% of transactions and 23.0% of value, person to person 30.8% and 71.2%
PhonePe
45.9%
Google Pay
32.3%
NPCI share cap
30%
Both leading apps sit above the 30% share cap NPCI set for UPI. The cap has been deferred rather than enforced, and the gap between the rule and the market is what makes it hard to enforce.
Source: Highlight 4 above: PhonePe 45.9%, Google Pay 32.3%, against the 30% cap
Overview
A reproducible research portfolio on Indian financial services: payments economics, bank margins, market structure and wealth. A Python pipeline over seven public sources feeds seven analysis modules and a static site, refreshed monthly by CI. Every figure, every exhibit and the machine-readable summary trace to a committed dataset and a dated source, and none of it is typed in by hand.
The problem
India built the world's largest real-time payments network and priced the busy half of it at zero. Who actually captures the value is asserted constantly and computed rarely, because the answer needs payments data, bank financials, market-share filings and fund data joined together and kept current.
The approach
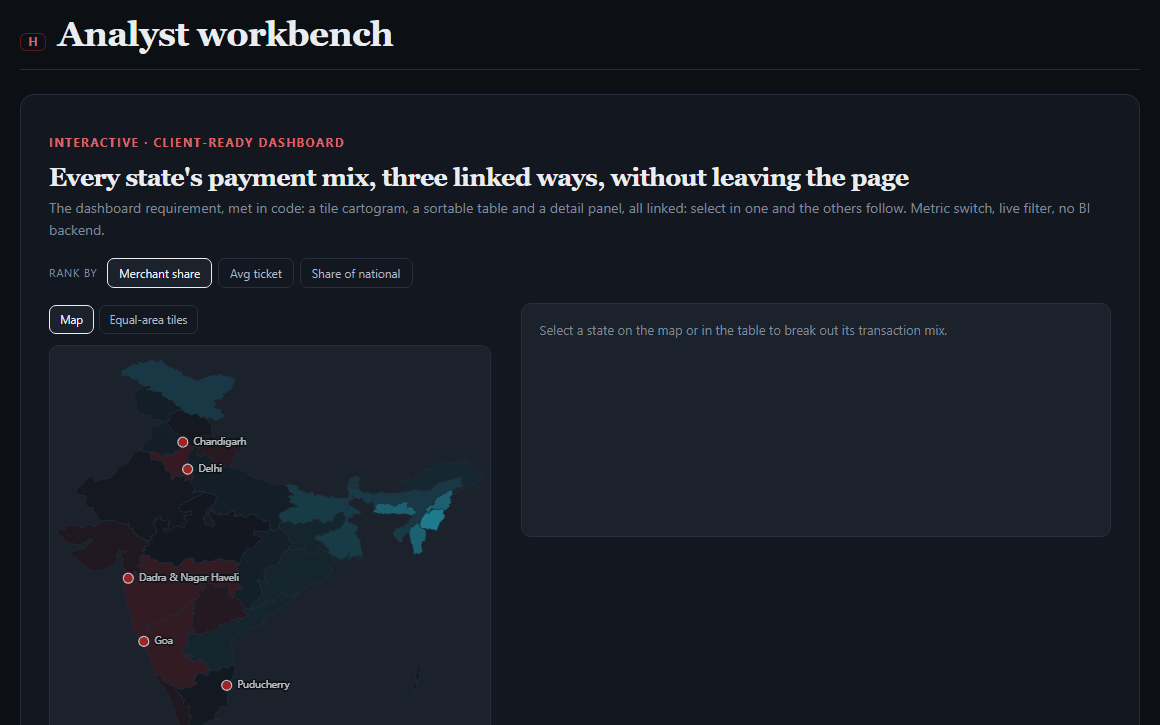
Seven public sources, PhonePe Pulse, NPCI, Yahoo Finance, AMFI and the World Bank among them, are pulled into a committed dataset and rebuilt monthly by GitHub Actions. Modules compute the merchant against person-to-person split, the growth bridge back to 2018, app concentration against the NPCI cap, a private against public bank margin decomposition, and a state-level merchant map. The site is generated from the same pipeline, so a claim on the page and the number behind it cannot drift apart.
What it found
- The finding: in 2026 Q2 merchant payments were 63.9% of all UPI transactions but only 23.0% of the rupees moved. Person to person is the mirror image at 30.8% of transactions and 71.2% of value
- The merchant leg is the only one a merchant discount rate could ever be charged on, and under zero-MDR it earns nothing: 50.7 million merchants, 487 transactions each per quarter, and Rs 0 of payment revenue. At 30bps the same leg would have been worth Rs 3,144 crore a quarter
- Merchant payments account for 64% of all volume growth since 2018 Q1, so the unmonetised leg is also the one carrying the network's expansion
- App concentration against policy: PhonePe holds 45.9% of national UPI volume and Google Pay 32.3%, both above the 30% cap, and roughly 4.3 billion transactions a month would have to change app for that cap to bind
- Private against public bank net interest margin gap of 114 bps, decomposed into 59 bps of pricing and 56 bps of funding, against a five year price return of +293% for public banks and +18% for private on median
- The fund shelf carries 14,288 schemes against 3,353 distinct strategies, a 4.3x wrapper ratio
- UPI transactions per banked adult per month reached 14.9, up from 4.0 in 2021
Stack
- Python
- PhonePe Pulse / NPCI / AMFI
- DuckDB
- GitHub Actions
- Static site