03Equities
Sellside Research Engine
An institutional-grade equity research dashboard: DCF to NLP tone scoring in one screen.
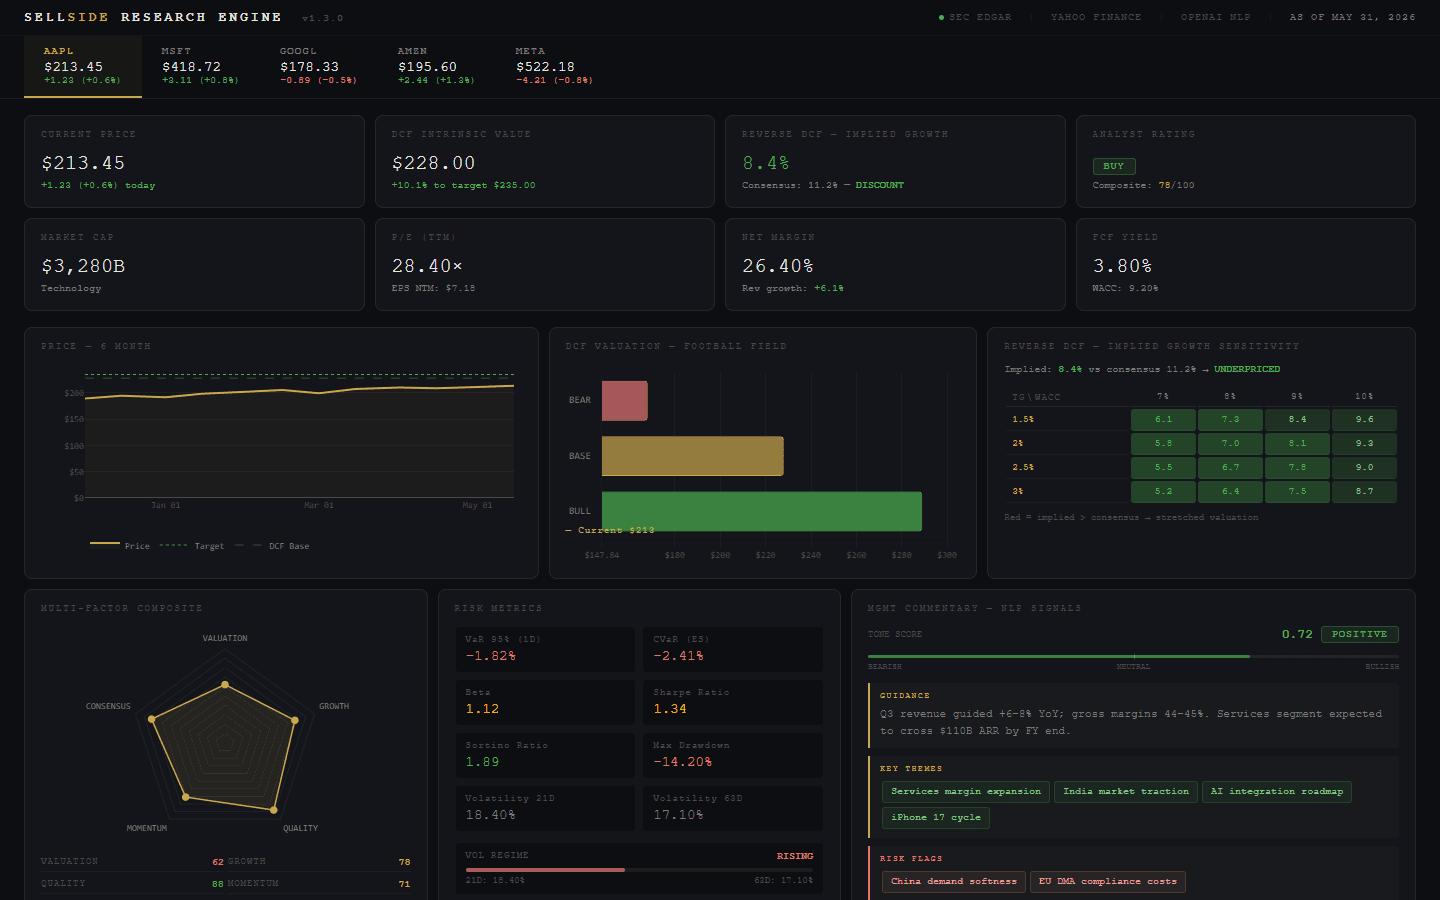
A single-screen research terminal covering DCF and reverse-DCF valuation, football-field charts, multi-factor composite scoring, full risk metrics (VaR, Sharpe, Sortino, drawdown), and NLP-scored management commentary from earnings calls.
- Domain
- Equities
- Artefact
- Dashboard
- Basis
- computes 8 risk metrics per ticker
- Stack
- SEC EDGAR · Yahoo Finance · OpenAI NLP · React · Recharts
What it produced
- 5
- factor pillars in composite
- 8
- risk metrics computed
- 8.4%
- implied growth vs 11.2% consensus
Consensus growth
11.2%
Market-implied growth
8.4%
Reverse DCF inverts the valuation: instead of discounting a growth assumption, it solves for the growth rate the current price already implies, then sets that against sell-side consensus. The gap is what raises the mispricing flag.
Source: Highlight 1 above: reverse DCF implied growth 8.4% against consensus 11.2%
The problem
A sell-side initiation note takes days of fragmented work: valuation in Excel, comps in another tab, risk metrics somewhere else, and management tone read by gut feel.
The approach
SEC EDGAR fundamentals and Yahoo Finance market data feed a DCF engine with an inverted reverse-DCF layer that solves for the growth the market is pricing in and compares it to consensus. A five-pillar composite (valuation, growth, quality, momentum, consensus) rolls up to a rating, and OpenAI-powered NLP scores management commentary tone, themes, and risk flags.
What it found
Reverse DCF implied-growth sensitivity grid: implied 8.4% vs consensus 11.2% → mispricing flag
Full risk suite: VaR 95%, CVaR, beta, Sharpe, Sortino, max drawdown, vol regime detection
NLP management-commentary scoring: tone, guidance extraction, key themes, risk flags
Football-field valuation chart and multi-factor composite rating out of 100